Jupyter Notebook
Python SDK를 사용하여 Jupyter Notebook에서 VulnCheck 데이터를 탐색하고 시각화합니다.
Jupyter는 마크다운과 코드를 하나의 캔버스 뷰(Notebook)로 쉽게 결합할 수 있게 해줍니다. 이 가이드는 VSCode에서 Jupyter Notebook을 설정하고 VulnCheck API를 Python SDK로 호출해 데이터를 가져온 후 차트를 표시하는 방법을 설명합니다.
VulnCheck의 Jupyter Notebook 라이브러리
VulnCheck 데이터로 작성된 Jupyter Notebook 모음은 GitHub에서 확인할 수 있습니다: https://github.com/vulncheck-oss/jupyter-notebooks
초기 설정
Jupyter Notebooks용 VSCode 가이드 를 먼저 참고하세요. "Hello, World!"를 출력할 수 있다면 이후 단계를 진행할 준비가 된 것입니다.
Windows 사용자는 긴 경로 지원(Long Path Support) 을 활성화해야 할 수도 있습니다.
Notebook 예제
- 새 노트북을 생성하고 이름을
botnet.ipynb로 지정합니다. - 첫 번째 셀에 의존성을 설치합니다:
%pip install vulncheck-sdk matplotlib pandas
- 다음 셀에 VulnCheck API에서 데이터를 가져오는 코드를 추가합니다 (
TOKEN값을 본인의 API 토큰으로 교체).
import vulncheck_sdk
import matplotlib as mpl
import matplotlib.pyplot as plt
import pandas as pd

DEFAULT_HOST = "https://api.vulncheck.com"
DEFAULT_API = DEFAULT_HOST + "/v3"
TOKEN = "insert_token_here"

configuration = vulncheck_sdk.Configuration(host=DEFAULT_API)
configuration.api_key["Bearer"] = TOKEN

with vulncheck_sdk.ApiClient(configuration) as api_client:
    indices_client = vulncheck_sdk.IndicesApi(api_client)
    api_response = indices_client.index_botnets_get()

    botnet_names = []
    cve_count = []

    for entry in api_response.data:
        botnet_names.append(entry.botnet_name)
        cve_count.append(len(entry.cve))

df = pd.DataFrame({
    'Botnets': botnet_names,
    'Unique CVEs': cve_count
})
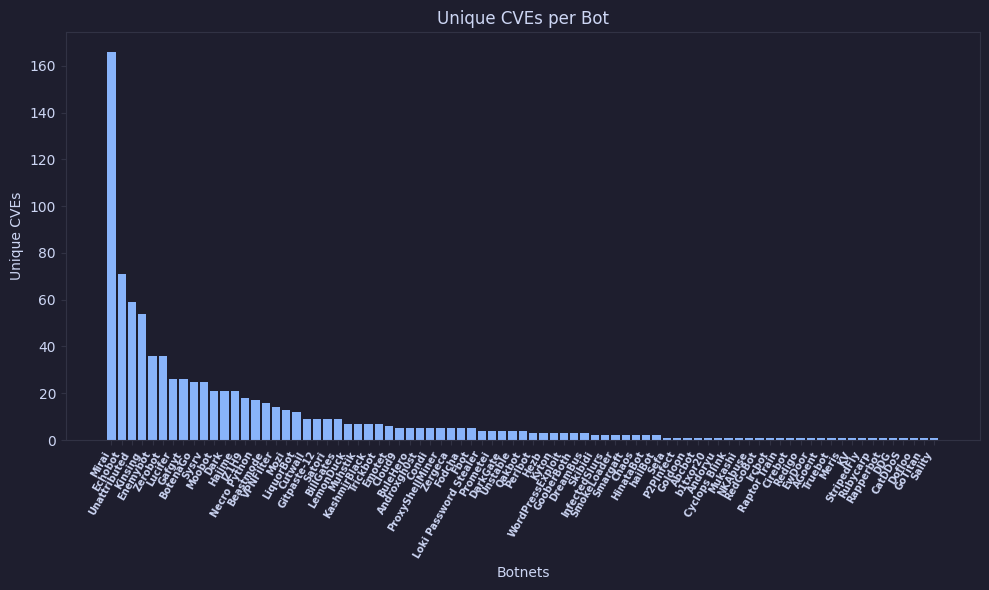
- 또 다른 셀을 생성하여 차트를 출력합니다:
df_sorted = df.sort_values(by='Unique CVEs', ascending=False)
plt.figure(figsize=(10, 6))

plt.bar(df_sorted['Botnets'], df_sorted['Unique CVEs'])

plt.title("Unique CVEs per Botnet")
plt.xlabel("Botnets")
plt.ylabel("Unique CVEs")

plt.xticks(rotation=60, ha='right', fontsize=7, fontweight='bold')

plt.tight_layout()
plt.show()